 Pulsar Science
Practice Plots
- Details
- Published on Sunday, 24 October 2021 08:00
When you score pulsar data plots you will be asked to score each sub-plot separately. If enough of the subplots look like a pulsar then it’s worth conducting a follow-up observation with the GBT!
In Prepfold Plots, the subplots you will grade are: Integrated Pulse Profile, Time Domain Plot, Sub-band Plot and DM Plot.

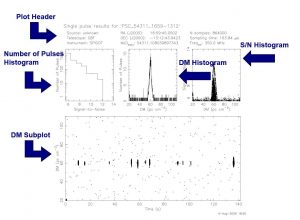
In Single Pulse Plots you will grade the DM subplot, S/N Histogram, and DM Histogram.
Ready to try grading some plots?
First Look at the plot below. What grade would you give each of the subplots? Your choices for each subplot are are “not a pulsar”, “maybe a pulsar” and “pulsar”.
There are several plots in each embedded slide show below. Each time you click on the image, a grade and an explanation will appear for a subplot. Try scoring these plots yourself, or together as a class or club. Advance to a new plot at the bottom of the slide deck using the right arrow. Discuss on the forum!
Prep-fold Periodicity Plots:
Single Pulse Plots: